
What Is ROI? Return on Investment Explained for Beginners
ROI tells you how much you made relative to what you put in. Here's the formula, worked examples, total vs annualised ROI, and what a good ROI looks like.
 By Timothy Hirou GaschereauPublished
 8 min read
Try it yourself
ROI is one of the first bits of investing jargon you'll bump into, and happily it's one of the simplest. This guide explains exactly what it means, how to calculate it, and what a “good” ROI actually looks like in Australia. It's part of our getting started series.
🎯 The essential: ROI (return on investment) measures how much you made relative to what you put in, as a percentage. The formula is (Final Value minus Initial Cost) divided by Initial Cost, times 100. Total ROI ignores time; annualised ROI (CAGR) lets you compare investments held for different periods.
What is ROI?
ROI stands for return on investment. It's a simple percentage that tells you how much you made (or lost) relative to what you put in. That's it. No jargon required.
Think of it this way: you put $1,000 into an ETF. A year later it's worth $1,200. You made $200 on a $1,000 outlay. Your ROI is 20%. Simple, clean, useful. Investors use ROI to compare opportunities, track performance, and work out whether a decision was actually worth it. It works across asset classes, whether you're looking at shares, property, a managed fund, or even a side hustle.
The ROI formula
The formula looks like this:
ROI (%) = [(Final Value − Initial Cost) / Initial Cost] × 100
Breaking it down:
- Final Value is what your investment is worth when you exit (or measure it).
- Initial Cost is what you paid to get in, including any upfront fees.
- You subtract the cost from the final value to get your gain (or loss).
- Then you divide by the initial cost and multiply by 100 to turn it into a percentage.
Worked example: you invest $5,000 in an ASX ETF. Three years later, you sell and receive $6,500.
- Final Value minus Initial Cost = $6,500 minus $5,000 = $1,500 gain
- Divide by Initial Cost: $1,500 / $5,000 = 0.30
- Multiply by 100: 0.30 × 100 = 30% ROI
You made a 30% return on your original $5,000. Not bad. If the result is negative, you made a loss. A negative ROI is still useful information: it tells you exactly how much you lost relative to your outlay.
How to calculate ROI step by step
Here's a repeatable four-step process you can apply to any investment:
- Step 1: Identify your initial cost. Everything you paid to get in: the purchase price, brokerage fees, stamp duty on property, or setup costs. Don't forget the fees, they eat into your return.
- Step 2: Identify your final value. What you walked away with. For shares, your sale proceeds. For property, the sale price minus selling costs. For a managed fund, the redemption value.
- Step 3: Subtract initial cost from final value to get your dollar gain (or loss).
- Step 4: Divide by initial cost, then multiply by 100 to get your ROI as a percentage.
Second worked example (managed fund): you invest $8,000. After four years, it's worth $10,400. Gain: $10,400 minus $8,000 = $2,400. ROI: ($2,400 / $8,000) × 100 = 30%. Same ROI percentage as the ETF example above. But this one took four years, not three. Does that matter? Absolutely. That's where annualised ROI comes in. This is also why low-cost index funds get so much attention: small differences in fees and returns compound over time.
Total ROI vs annualised ROI (and why it matters)
Total ROI is the raw percentage gain over the entire period you held the investment. It's easy to calculate and easy to understand, but it has a blind spot: it ignores time. A 40% return sounds great. But 40% over two years is very different from 40% over ten years. Total ROI can't tell you which is better.
Annualised ROI (also called CAGR, or Compound Annual Growth Rate) fixes that. It converts your total return into a consistent per-year figure, so you can compare investments held for different lengths of time on an even footing.
Annualised ROI = [(Final Value / Initial Value)^(1/n) − 1] × 100
Where n is the number of years you held the investment. For example, invest $10,000 and after three years it's worth $14,000. Total ROI is 40%. Annualised ROI is (14,000 / 10,000)^(1/3) minus 1, which is roughly 11.9% per year, compounded. Now imagine a different investment that also returned 40% total, but took ten years. Its annualised ROI would be just 3.4% p.a. Same total return, very different story.
When you're comparing investments, always use annualised ROI. Total ROI is fine for a quick snapshot; annualised ROI is what actually tells you how hard your money was working. This is the same compounding maths that makes long-term investing so powerful.
What is a good ROI? (realistic Australian benchmarks)
“Good” is relative. A 5% ROI on a savings account is excellent for that risk level. A 5% ROI on a speculative small-cap stock is disappointing. Context is everything. Here are some long-run benchmarks for Australian investors:
| Asset class | Typical annual ROI | Risk level |
|---|---|---|
| High-interest savings account | ~4 to 5% p.a. | Very low |
| Term deposit | ~4 to 5% p.a. | Very low |
| Australian shares (ASX 200) | ~10% p.a. (long-run, with dividends) | Medium to high |
| Global shares (MSCI World) | ~9 to 10% p.a. (long-run) | Medium to high |
| Australian residential property | ~6 to 7% p.a. (capital growth, before costs) | Medium to high |
| Active managed funds (after fees) | ~6 to 8% p.a. (variable) | Medium to high |
A few things worth noting. Past returns don't guarantee future results. The ASX 200's long-run average looks smooth on a chart, but the ride includes the GFC, the COVID crash, and plenty of ugly years in between. As a rough rule of thumb: if your ROI is beating inflation (currently around 3 to 4% p.a. in Australia) and matching or exceeding a risk-free benchmark like a term deposit, you're at least keeping your money working. Beating the ASX 200 long-run average consistently is something most professional fund managers fail to do.
The limitations of ROI
ROI is a useful tool, but it's not the whole picture. Here's where it falls short:
- It ignores time. A 50% ROI sounds impressive until you find out it took 25 years. Always pair total ROI with the time period.
- It ignores risk. Two investments can have identical ROIs but completely different risk profiles. ROI doesn't capture the chance you took to get there.
- It ignores cash flow timing. ROI treats all returns as if they arrived at the end, ignoring dividends or rent received along the way.
- It can be gamed by date selection. Choosing a favourable start or end date can make any investment look good. An ROI figure without a stated time period should raise an eyebrow.
- It doesn't adjust for inflation. A 6% ROI in a year when inflation runs at 5% leaves you with a real gain of just 1%. Real ROI (nominal ROI minus inflation) is what tells you whether your purchasing power grew.
ROI vs other metrics (brief)
ROI is a great starting point, but investors use several other metrics depending on what they're measuring:
- IRR (Internal Rate of Return): accounts for the timing of cash flows in and out, useful for property or business investments with irregular cash flows.
- CAGR (Compound Annual Growth Rate): essentially the same as annualised ROI. The standard metric for multi-year performance.
- Sharpe Ratio: adjusts returns for risk. A higher figure means more return per unit of risk taken.
- Dividend yield / rental yield: income-focused metrics that measure the cash return from an investment, separate from capital growth.
None of these replace ROI. They complement it. The more metrics you understand, the clearer the picture you get. If you're just starting out, our guide on how to start investing and tracking your net worth are good next reads.
SnowLetter
Australia's money news and our best reads, once a week.
❓ Frequently asked questions
Is ROI the same as profit?
+
Not quite. Profit is a dollar figure (how much you made). ROI is a percentage (how much you made relative to what you put in). A $500 profit on a $1,000 investment is a 50% ROI. A $500 profit on a $50,000 investment is just 1%. ROI gives you context that raw profit doesn't.
Can ROI be negative?
+
Yes, and it's useful when it is. A negative ROI means you lost money relative to your initial outlay. For example, if you invested $5,000 and walked away with $4,000, your ROI is -20%. Knowing your loss as a percentage helps you compare it to other decisions and learn from it.
What's the difference between ROI and an interest rate?
+
An interest rate is the cost of borrowing money (or the return on a deposit), expressed as a percentage per year. ROI is broader: it measures the total return on any investment over any period, and it's not automatically annualised. A savings account's interest rate is essentially its annualised ROI. For other investments, you need to calculate ROI yourself.
Does ROI include dividends?
+
It depends on how you calculate it. If you include dividends received in your final value (or add them to your gain), then yes. If you only look at the change in price, you're measuring capital growth ROI only. For a complete picture of share or property returns, always include income (dividends or rent) in your ROI calculation.
Is a higher ROI always better?
+
Not automatically. A higher ROI often comes with higher risk. A 30% ROI on a speculative investment that could have gone to zero is very different from a 7% ROI on a diversified index fund. Always consider the risk you took to achieve the return, and whether the time period was fair for comparison.
How does inflation affect ROI?
+
Inflation erodes purchasing power, so a nominal ROI of 5% in a year when inflation runs at 4% leaves you with a real gain of just 1%. To calculate your real ROI, subtract the inflation rate from your nominal ROI. Over long periods, inflation has a significant compounding effect on whether your wealth is actually growing in real terms.
📚 Recommended reading
The Psychology of Money
Morgan Housel
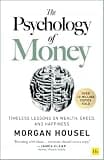
The Psychology of Money
19 short stories on how people actually think and feel about money, not just the maths of it.
The Simple Path to Wealth
JL Collins
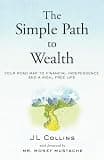
The Simple Path to Wealth
The friendliest on-ramp to index investing there is, born from letters a dad wrote his daughter. It makes 'buy the whole market and chill' feel obvious, just map his US fund picks onto Aussie equivalents and super.
The Barefoot Investor
Scott Pape

The Barefoot Investor
Australia's best-selling money book ever. A simple system for accounts, budgeting, debt and a real emergency fund in one.
Some links above are affiliate links. If you buy through them, Snowball Invest may earn a small commission at no extra cost to you. We only recommend books we'd suggest anyway.
Sources
This article is general information only, not financial advice. Investment returns vary and past performance is not a reliable indicator of future results. Consider your personal circumstances and speak with a licensed financial adviser before making investment decisions.
Was this article useful?
Put it to your own numbers
Every calculator runs entirely in your browser, with nothing stored. See what these numbers look like for your own situation.
Try the Compound Interest calculator →General information only. This article is educational and does not constitute personal financial advice. It does not account for your circumstances. Consider your own situation and seek advice from a licensed adviser before acting. Read our full disclaimer.

Timothy Hirou Gaschereau
Founder of Snowball Invest, not a financial adviser.
I write about what I'm learning myself, because nobody ever taught us how to take control of our own money. It's a skill, not a mystery, and it's never too late to learn it. The best day to start was yesterday, the second best is today.
LinkedIn →Related articles

CommSec Pocket Fees: What It Costs and How It Compares
A$2 a trade up to A$1,000, then 0.20%, on buys and sells. Plus the separate HIN nobody mentions, and the order size where Pocket costs more than main CommSec.

BGBL vs VGS: Which Global ETF Belongs in Your Portfolio?
BGBL charges 0.08% and holds South Korea. VGS charges 0.18% and does not. What actually separates the two big ASX global ETFs, and how to pick one.

IVV vs VGS: All In on America, or the Whole Developed World?
This is not a fee decision, it is a concentration one. IVV is one country. VGS is 23, and the US is already most of it. How to think it through.