

Compound Interest Calculator
Estimate how much your initial investment and regular contributions could grow over time, thanks to the power of compounding.
Built and checked byTimothy Hirou GaschereauFigures verified at the source on
Your details
Your total wealth in 10 years
$36,177
Initial investment
$1,000
Total contributions
$24,000
Investment return
$11,177
In today's dollars, that's worth about $28,262 after 2.5% inflation. The headline number looks bigger, but this is what it would actually buy in the future.
This calculator gives an estimate only, assuming a constant annual growth rate. It does not account for taxes or fees. The today's-dollars figure discounts your balance by the inflation rate you entered, so you can see its real spending power. Not financial advice.
How to use this calculator
- 1. Enter your initial investment, the investment period, and the growth rate you expect per year.
- 2. Add how much you plan to contribute regularly, and how often: weekly, monthly or annually.
- 3. Your projected total wealth updates instantly, along with a year-by-year breakdown of your initial investment, contributions and investment return.
The maths behind the number on your screen
The calculator above is doing the same thing a financial calculator has always done, just faster and without the tiny buttons. The formula is A = P(1 + r/n)nt, where A is your final balance, P is your initial investment, r is the annual rate as a decimal, n is how many times a year it compounds, and t is the number of years. Feed in $10,000 at 7% p.a. compounded annually for 10 years and you get $10,000 x (1.07)10 = $19,672. No extra deposits, just $10,000 left alone earning $9,672.
Add $500 a month in regular contributions to that same scenario and the final balance jumps to roughly $106,637. You put in $70,000 across the decade ($10,000 up front plus $500 x 120 months), and the calculator hands back an extra $36,637 that you never actually deposited. That gap is pure compounding, and it's bigger than most people expect because every contribution starts earning its own return the moment it lands, not just the original lump sum. If you want the plain-English version of why this works, our what is compound interest guide breaks down the mechanics without the algebra.
| Simple interest | Compound interest | |
|---|---|---|
| Interest earned | $7,000 | $9,672 |
| Final balance | $17,000 | $19,672 |
Simple interest pays a flat $700 a year, every year, on the original $10,000. Compound interest pays 7% of whatever the balance has grown to, so each year's dollar amount is bigger than the last. That gap only widens the longer you leave it running.
Why contribution frequency quietly changes your result
Here's a lever most people never touch: even if the total amount you contribute each year stays exactly the same, splitting it into smaller, more frequent deposits gets you a bigger final balance. Money contributed earlier in the year starts compounding sooner, so weekly beats monthly, and monthly beats one annual lump sum.
| Contribution method | Annual amount | Approx. final balance |
|---|---|---|
| Once a year (lump sum) | $6,000 | ~$296,500 |
| $500 a month | $6,000 | ~$305,200 |
| $115.38 a week | $6,000 | ~$307,400 |
That's roughly a $10,900 gap between annual and weekly contributions of the exact same yearly total, over 20 years at 8% p.a. If your broker or savings account supports weekly or fortnightly auto-invest, switching to it is a genuinely free upgrade, no extra money required, just better timing. This is essentially dollar cost averaging at work: use the calculator above to model your actual contribution schedule, not just the annual total, and see what it's really costing (or earning) you.
Realistic return rates for Australian investors
The return rate you enter drives more of the outcome than any other input, so it pays to ground it in something real rather than a hopeful guess. The ASX and the RBA both publish long-run data that puts the ASX All Ordinaries at roughly 9% to 10% p.a. nominal, including dividends reinvested. A diversified ETF portfolio blending Australian and international shares is more commonly modelled at 7% to 8% p.a. High-interest savings accounts and term deposits, being far lower risk, sit well below that.
| Asset class | Typical return assumption | Best used for |
|---|---|---|
| ASX All Ordinaries / broad share ETFs | 7% to 9% p.a. nominal | Long-term wealth building (10+ years) |
| Diversified ETF portfolio (e.g. VAS/VGS) | 7% to 8% p.a. nominal | Core investment portfolio modelling |
| High-interest savings account | 4.5% to 5.5% p.a. | Short-term savings goals (1 to 5 years) |
| Term deposit | 4.5% to 5% p.a. | Fixed-term savings with a guaranteed rate |
| Super, balanced option (net of fees and tax) | 5% to 6% p.a. | Superannuation balance projections |
These are historical averages and planning assumptions, not guarantees. Past performance doesn't predict future results, and any given year can land well above or below these long-run figures.
Common mistakes when using a compound interest calculator
- Using nominal returns without adjusting for inflation. An 8% return sounds great, but at 2.5% to 3% inflation your real purchasing power is growing closer to 5% to 5.5%. Subtract your expected inflation rate before entering a return figure if you want today's dollars, not future dollars.
- Forgetting fees. A low-cost ETF barely dents the outcome, but a managed fund or super option charging 1% to 1.5% p.a. can cost you tens of thousands of dollars over a few decades. Subtract the total annual fee from the rate you enter.
- Ignoring tax. This calculator shows gross growth. Returns held outside super are taxed at your marginal rate (with a CGT discount on long-held assets), and super earnings are taxed at 15% inside the fund. Trim your return rate by a point or two to approximate an after-tax figure.
- Assuming contributions are perfectly consistent. Life happens. A 30-year projection at $500 a month is a best case. Run the numbers again at 70% of that contribution to see the realistic range.
- Over-optimising for the best-case rate. Entering 12% because of one great year you read about isn't planning, it's hoping. Always run a conservative scenario alongside your base case.
How to stress-test your projection
One number from the calculator isn't a plan. A range is. Run the same contribution amount and time period three times: a conservative 5% p.a. (roughly a balanced super fund or a high-interest savings account), a base case of 7.5% p.a. (a reasonable long-run assumption for a diversified ETF portfolio), and an optimistic 10% p.a. (in line with the long-run ASX average, though never guaranteed). If your conservative scenario still gets you where you need to be, your plan is solid. If you need the optimistic number to work, you're carrying more risk than you might realise.
FAQ
What is the best compound interest calculator for Australians?
The best one supports regular contributions at multiple frequencies (weekly, monthly, annually), works in AUD, and lets you adjust the return rate to match Australian asset classes. Snowball's calculator is built for that. ASIC's Moneysmart calculator is also a solid free option for simple scenarios.
How much will $10,000 grow in 10 years in Australia?
At 7% p.a. compounded annually with no extra contributions, $10,000 grows to roughly $19,672 after 10 years. Add $500 a month in contributions on top and the balance reaches around $106,637. The exact figure depends entirely on the return rate you actually achieve.
How does contribution frequency affect compound interest?
Contributing more often means your money starts compounding sooner. $6,000 invested weekly ($115.38 a week) produces a higher final balance than the same $6,000 invested as one annual lump sum, even though the yearly total is identical. Over 20 years at 8% p.a., weekly versus annual contributions of the same total amount can differ by roughly $10,900.
What return rate should I use for an Australian share portfolio?
For a diversified Australian share portfolio or a VAS/VGS style ETF blend, 7% to 8% p.a. nominal is a commonly used long-run planning assumption. The ASX All Ordinaries has historically delivered around 9% to 10% p.a. nominal including dividends, but a conservative planner usually discounts that for fees, tax, and the chance of lower future returns. Always run a second scenario at 5% to 6% as a stress test.
Does this calculator account for inflation?
No, the output is nominal, meaning it's in future dollars that haven't been adjusted for inflation. To model real purchasing power, subtract your expected inflation rate (typically around 2.5% to 3% for Australia) from the return rate you enter. Try 5% instead of 7.5% to see roughly what your balance is worth in today's dollars.
How is compound interest different from simple interest?
Simple interest only calculates a return on your original principal. Compound interest calculates a return on the principal plus every return it has already earned. On $50,000 at 6% p.a. over 20 years, simple interest gets you to $110,000, compound interest gets you to $160,357. The gap widens every year because compound interest is earning returns on its own returns.
Can I use this calculator for my superannuation?
Yes. Enter your current super balance as the initial investment, your employer plus any voluntary contributions as the regular contribution, and use a return rate that reflects super's 15% earnings tax and your fund's fees. A net return of 5% to 6% p.a. is a reasonable planning assumption for a balanced option. MoneySmart's retirement planner is worth using alongside this tool for a more detailed super projection.
What is the compound interest formula?
The standard formula is A = P(1 + r/n)^(nt), where A is the final amount, P is the principal, r is the annual interest rate as a decimal, n is the number of compounding periods per year, and t is the number of years. When you add regular contributions, a separate annuity formula applies on top. This calculator handles both automatically.
How much do I need to invest to reach $1 million?
It depends on your starting amount, return rate, and time horizon. At 7.5% p.a. starting from $0, contributing $1,000 a month gets you to roughly $1 million in around 26 years. Starting with $50,000 and contributing $500 a month at the same rate gets there in about 23 years. Adjust the inputs above to find the combination that fits your situation.
Is compound interest taxed in Australia?
Yes. Returns from investments held outside super are taxed. Dividends and distributions are taxed at your marginal rate (with a franking credit offset for Australian shares), and capital gains on assets held over 12 months get a 50% CGT discount. Inside super, earnings are taxed at 15%. This calculator doesn't model tax, so reduce your return rate input to approximate an after-tax figure.
How accurate is a compound interest calculator?
It's accurate as a mathematical model of the inputs you give it. The real uncertainty sits in the inputs themselves, especially the return rate. Actual investment returns vary year to year, and no calculator can predict future market performance. Treat the output as a planning range rather than a forecast, and run a conservative, base, and optimistic scenario to get a more honest picture.
What is the Rule of 72 and how does it apply?
It's a quick mental shortcut: divide 72 by your annual return rate to estimate how many years it takes your money to double. At 7.2% p.a., your investment doubles in about 10 years. At 9% p.a., about 8 years. At 4.5% p.a. (roughly a current high-interest savings rate), about 16 years. Use it as a quick sanity check on the calculator's output before you dig into the detailed numbers.
Related reading

Pay Off Mortgage or Invest? The Honest Australian Guide
Should you pay off your mortgage or invest your spare cash? We break down the real maths, the tax angle, offset accounts, super, and a worked example for Australian homeowners.

How to Invest in Bonds in Australia: The Practical Guide
Exactly how to invest in bonds in Australia, from bond ETFs to government bonds, with real tickers, costs, tax treatment, and how much to hold at every life stage.

Raiz Review 2026: Is the Micro-Investing App Worth It for Australians?
An honest, balanced Raiz Invest review for 2026. We break down the fees, portfolios, round-ups, tax treatment, and how Raiz compares to Spaceship and buying ETFs directly.
Where these numbers come from
Every rate and threshold in this calculator was read off the official page, not copied from another calculator. Check them yourself, they change.
📚 Recommended reading
The Simple Path to Wealth
JL Collins
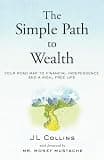
The Simple Path to Wealth
The friendliest on-ramp to index investing there is, born from letters a dad wrote his daughter. It makes 'buy the whole market and chill' feel obvious, just map his US fund picks onto Aussie equivalents and super.
Just Keep Buying
Nick Maggiulli
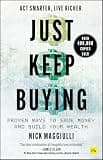
Just Keep Buying
Data over vibes. Maggiulli crunches the numbers to show that consistently buying assets beats trying to time the market, and it is easier than you think.
Some links above are affiliate links. If you buy through them, Snowball Invest may earn a small commission at no extra cost to you. We only recommend books we'd suggest anyway.
SnowLetter
Australia's money news and our best reads, once a week.
Disclaimer
The results provided by this calculator are estimates only, based on the assumptions you enter, and are not a prediction or financial advice. Actual investment returns will vary. Consider speaking with a licensed financial adviser before making any financial decision.