

How to Read Crypto Charts: A Beginner's Guide
How to read crypto charts: candlesticks, volume, support and resistance, trends, and a couple of indicators, with an honest warning that TA is not prediction.
 By Timothy Hirou GaschereauPublished
 11 min read
A crypto price chart looks intimidating until someone shows you what the pieces actually mean. Once you can read a single candlestick, the rest of the chart falls into place. This is a plain-English beginner's guide, and an honest one: charts are a tool for understanding price history, not a crystal ball for predicting it.
Here is how to read the essentials, with the reality check most crypto content skips.
🎯 The essential: A price chart shows price (y-axis) over time (x-axis), and beginners should start on the daily timeframe to cut the noise. Candlestick charts beat line charts because each candle shows four things: open, high, low and close. Green means price closed above where it opened, red means below; the body is the open-to-close range and the wicks reach to the high and low. Volume confirms how much to trust a move; support and resistance are levels where buying or selling tends to cluster. The honest truth: technical analysis is not prediction, patterns fail often, and in Australia every trade is a CGT event. Not financial advice, and crypto is high-risk.
What a crypto chart actually shows
Every chart has the same layout: price runs up the y-axis (in AUD or USD), and time runs along the x-axis. Everything else, the colours, lines and indicators, is just a way of interpreting that core price-over-time data. The timeframe you choose changes the picture dramatically: 1-minute candles are all noise, while daily and weekly views show the smoother, meaningful trends. If you are learning, start on the daily chart. New to crypto entirely? Our guide to choosing an exchange covers the practical first steps.
Line chart vs candlestick chart
A line chart connects only closing prices: clean, but it throws away where price opened and how high or low it went. A candlestick chart shows four data points for every period (open, high, low, close), which is why almost everyone who reads charts seriously uses candlesticks. Learn one candle and the rest follows.
How to read a single candlestick
This is the foundation. Get it right and everything else clicks:
| Part | What it shows | Might suggest |
|---|---|---|
| Large green body | Strong buying | Bullish momentum |
| Large red body | Strong selling | Bearish momentum |
| Long upper wick | Rejected higher up | Sellers in control there |
| Long lower wick | Rejected lower down | Buyers stepped in |
| Small body, long wicks | Neither side won | Indecision or possible reversal |
What volume tells you
Volume is how many units were traded in a period, shown as bars along the bottom. It is a confirmation tool, not a direction predictor. A price move (like a breakout above a level price was stuck under) means much more on unusually high volume, because more participants were involved and the move has conviction. The same move on thin volume is worth watching but not acting on. Volume tells you how much to trust the move that just happened, which is meaningful but limited.
Support, resistance and trend
Support is a price level where buying has historically emerged and price has bounced up; resistance is where selling emerges and price stalls (previous highs and round numbers like $100,000 for Bitcoin often act as resistance). Markets have memory, so these zones form from collective behaviour, and a broken support can flip to become resistance (and vice versa). Trend is the bigger direction: an uptrend is higher highs and higher lows, a downtrend is lower highs and lower lows, and a trend line joins those points to visualise it.
Support, resistance and trend lines are zones and rough guides, not exact lines. Price can slice straight through a level that held perfectly three times before, and two people can draw completely different trend lines on the same chart. Treat them as areas of interest, never guarantees.
A plain-English look at common indicators
Indicators are calculations on past price data. They summarise the past in a different format; they do not predict the future. Two you will hear about most: moving averages smooth price into a line (the 50-day and 200-day are most watched; a "golden cross" is the 50-day crossing above the 200-day, seen as bullish, and a "death cross" is the reverse), but they lag, so a big part of a move may be over by the time a cross forms. RSI is a 0 to 100 gauge where above 70 is conventionally "overbought" and below 30 "oversold", but overbought can stay overbought for a long time in a strong trend, so it is a prompt to ask questions, not a trigger. Every indicator is derived from past price; none predicts the future.
The honest reality check
Technical analysis is pattern recognition applied to past data, not a system that reliably produces profits, and it fails regularly. Crypto is driven heavily by sentiment, news and macro events (a single tweet has moved markets double digits in hours), which no chart can account for. Chart patterns have significant failure rates, most retail traders who trade on charts lose money, and confirmation bias means the chart will look bullish when you want to buy and bearish when you want to sell. The more you stare at short-term charts, the more you overtrade, rack up fees, and generate a string of CGT events.
The most useful thing charts offer is patience and context: seeing on a weekly chart that a 20% drop is a normal fluctuation in a longer uptrend, rather than a catastrophe. In Australia, every disposal of crypto (including swapping one coin for another) is a CGT event, the 50% discount may apply after 12 months, and the ATO receives exchange data, so keep records of every trade. Our crypto tax guide and does the ATO know about your crypto cover the tax side.
Frequently asked questions
What is the best chart type for crypto beginners?
+
Candlestick charts, even though they look more complex than line charts at first. Each candle shows the open, high, low and close for a period, which is far more information than a line chart's single closing price. Learn the anatomy of one candle and the rest follows.
What does a green candlestick mean?
+
The closing price was higher than the opening price, so price went up during that period (some platforms show it as white). A larger green body means stronger buying pressure during that candle.
What does a red candlestick mean?
+
The closing price was lower than the opening price, so price fell during that period (some platforms use black). A large red body means strong selling pressure; a small body with long wicks means the move was contested and neither side dominated.
What is a good RSI level to buy crypto?
+
There is no 'good' level. An RSI below 30 is conventionally called oversold, which some read as a potential opportunity, but oversold assets can keep falling for a long time. RSI is a momentum gauge, not a buy or sell signal, and should never be used alone. This is educational only, not financial advice.
Do crypto charts actually work?
+
They give you a structured way to look at price history and spot patterns, but they do not reliably predict future prices. Chart patterns fail often, crypto is heavily driven by news and sentiment no chart can anticipate, and most retail traders relying on technical analysis do not make money consistently. Use charts for context, not as a trading system.
What timeframe should I use?
+
For beginners, the daily chart is the best starting point: it filters out short-term noise and shows recent behaviour over weeks and months. Move to the weekly for broader context once comfortable. Short timeframes like 1-minute charts are overwhelming for beginners and encourage overtrading.
Do I pay tax on crypto trades in Australia?
+
Yes. The ATO treats crypto as a CGT asset, so every disposal (including swapping one coin for another) is a CGT event, though the 50% discount may apply if you hold over 12 months as an individual. The ATO receives data from Australian exchanges, so trades are not invisible. Keep records of every trade and see a registered tax agent.
Keep reading
Books worth reading
📚 Recommended reading
The Psychology of Money
Morgan Housel
The Psychology of Money
19 short stories on how people actually think and feel about money, not just the maths of it.
Rich Dad Poor Dad
Robert Kiyosaki

Rich Dad Poor Dad
The book that got millions of people thinking differently about assets, income and building wealth.
The Simple Path to Wealth
JL Collins
The Simple Path to Wealth
The friendliest on-ramp to index investing there is, born from letters a dad wrote his daughter. It makes 'buy the whole market and chill' feel obvious, just map his US fund picks onto Aussie equivalents and super.
Some links above are affiliate links. If you buy through them, Snowball Invest may earn a small commission at no extra cost to you. We only recommend books we'd suggest anyway.
Sources
General information only, not financial, investment or tax advice. Cryptocurrency is a high-risk, speculative asset and you could lose all your money. Technical analysis does not predict prices. Consider your own circumstances and a licensed adviser and registered tax agent before acting.
Was this article useful?
Put it to your own numbers
Every calculator runs entirely in your browser, with nothing stored. See what these numbers look like for your own situation.
Explore the calculators →General information only. This article is educational and does not constitute personal financial advice. It does not account for your circumstances. Consider your own situation and seek advice from a licensed adviser before acting. Read our full disclaimer.

Timothy Hirou Gaschereau
Founder of Snowball Invest, not a financial adviser.
I write about what I'm learning myself, because nobody ever taught us how to take control of our own money. It's a skill, not a mystery, and it's never too late to learn it. The best day to start was yesterday, the second best is today.
LinkedIn →Related articles
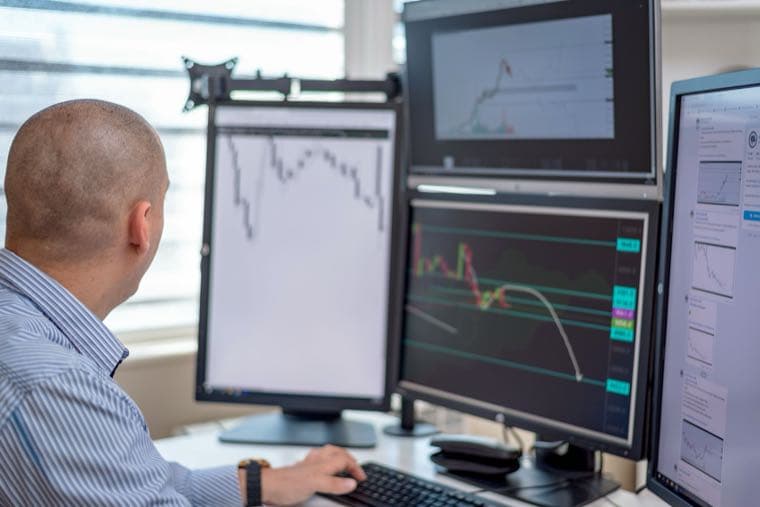
How to Day Trade Crypto in Australia
Curious about day trading crypto in Australia? What it actually involves, the real risks, how the ATO taxes traders, and why most beginners lose.
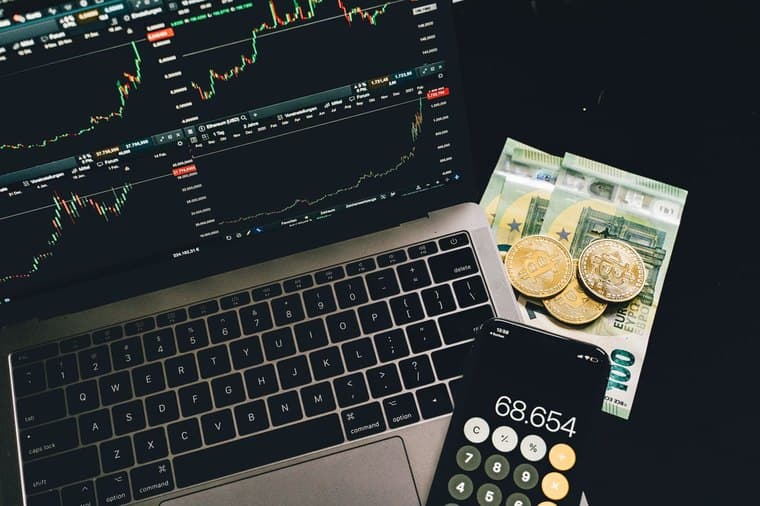
CoinSpot Review 2026: Is Australia's Biggest Crypto Exchange Worth It?
An honest CoinSpot review: the coin range, security, the fee trap (1% instant vs 0.1% market), the real cons, how it compares, and who it suits.
Crypto Staking in Australia: How It Works and the Honest Risks
How crypto staking works in Australia: the ways to stake, realistic reward rates, and the honest risks (volatility, lock-ups, slashing, counterparty), plus tax.