

Investing Duration Calculator
Find out roughly how long it will take to reach a savings or investing goal, based on what you're starting with and adding along the way.
Built and checked byTimothy Hirou GaschereauFigures verified at the source on
Your details
Time to reach your goal
8 yrs 6 mos
Goal amount
$50,000
Total contributions
$30,600
Investment return
$14,529
Heads up: by the time you reach it, $50,000 will only buy about $40,552 in today's money after 2.5% inflation. For a big goal, aim a bit higher than the number that feels right today.
This calculator gives an estimate only, assuming a constant annual growth rate and contribution amount. It does not account for taxes, fees or inflation, and is not financial advice.
How to use this calculator
- 1. Enter your current savings and the amount you're aiming to reach.
- 2. Enter the annual growth rate you expect, plus how much you plan to add regularly and how often.
- 3. The calculator works out roughly how many years and months it will take to hit your goal, with a year-by-year breakdown.
What actually drives your investing timeline
The calculator gives you a number. Understanding why that number is what it is helps you actually do something with it. Four inputs determine how long it takes to reach a savings or investing goal: your starting balance, how much you add regularly, the return rate you earn, and the goal itself. Every other variable is just a version of one of those four.
Contributions and return rate pull in the same direction, but they're not equal. Increasing your regular contributions has a direct, predictable effect on your timeline. Chasing a higher return rate to shorten it is riskier, since higher returns generally come with higher volatility, and volatility cuts both ways. If you can add even a small amount more each month, that tends to compress your timeline more reliably than assuming a more optimistic return. For a deeper dive into why this compounding effect matters so much, see our guide on what compound interest actually is.
Compound interest means you earn returns on your returns, not just on what you put in. In the early years this effect is modest. Over a longer timeline it becomes the dominant force, which is why starting earlier with a smaller amount often beats starting later with a larger one.
How long does it actually take? AU milestone scenarios
These worked examples start from $0, with monthly contributions and monthly compounding, using the standard compound growth formula. They're a useful sense check against whatever number your own inputs spit out.
| Target | Monthly contribution | Annual return | Time to reach it |
|---|---|---|---|
| $50,000 | $300 | 6% (conservative) | ~10.1 years |
| $50,000 | $700 | 8% (moderate) | ~4.9 years |
| $50,000 | $1,500 | 10% (aggressive) | ~2.5 years |
| $100,000 | $300 | 6% (conservative) | ~16.4 years |
| $100,000 | $700 | 8% (moderate) | ~8.4 years |
| $100,000 | $1,500 | 10% (aggressive) | ~4.4 years |
| $500,000 | $300 | 6% (conservative) | ~37.3 years |
| $500,000 | $700 | 8% (moderate) | ~22.0 years |
| $500,000 | $1,500 | 10% (aggressive) | ~13.3 years |
| $1,000,000 | $300 | 6% (conservative) | ~48.0 years |
| $1,000,000 | $700 | 8% (moderate) | ~29.5 years |
| $1,000,000 | $1,500 | 10% (aggressive) | ~18.9 years |
Return assumptions are based on long-run Australian and global diversified ETF performance (think VAS, VGS, DHHF), before tax but after a typical low-cost ETF fee of 0.07 to 0.23%. 8% is a reasonable moderate assumption for a diversified AU/global mix, and 10% reflects the long-run historical average for Australian shares including dividends, so treat it as the optimistic end.
Look closely at the $1,000,000 row at 8%. It takes about 29.5 years to get there on $700 a month, but the last $500,000 of that only takes about 7.5 years, less than a third of the total time. The first $100,000 takes 8.4 years. The second $100,000 takes about 5. By the time a portfolio is nudging $500,000, it's generating tens of thousands of dollars in returns every year on its own. The early years feel slow because your contributions are carrying almost all the weight. After $100,000, returns start pulling harder. After $300,000 to $400,000, the portfolio's own growth starts to rival your monthly contribution, and that's genuinely when it gets exciting. It's also why the first $100,000 is the hardest milestone: not just psychologically, but mathematically. Push through it and the trajectory changes.
The assumptions that can wreck your timeline
The calculator is only as good as what you put into it. Four assumptions trip people up more than any others.
Ignoring inflation. The calculator works in nominal dollars, so it doesn't adjust for rising prices. The RBA targets inflation of 2 to 3% a year, and at the midpoint of 2.5%, an 8% nominal return is only about 5.5% in real terms. Over a 20 year goal at 2.5% inflation, a $1,000,000 nominal target is worth roughly $610,000 in today's money. The simplest fix is to subtract 2 to 2.5% from your expected nominal return and use that figure instead.
Unrealistic return assumptions. The ASX 200 has returned roughly 9 to 10% a year including dividends over the long run, before fees and tax. After a low-cost ETF fee of 0.07 to 0.23% and some tax drag, a realistic figure for a diversified AU and global ETF portfolio is 7 to 9% a year. If your plan only works at 15%, the fix is more contributions, not a rosier return.
Forgetting fees. Fees compound too, just in the wrong direction. Investing $500 a month at 8% for 30 years gets you to roughly $745,000. Drop that to 7.5% to reflect a fund charging 0.5% more in annual fees, and you land closer to $674,000, a $71,000 difference from what looks like a tiny percentage. Low-cost ETFs typically charge 0.07 to 0.23%, managed funds often charge 0.5 to 1.5%. Make sure the return you enter is net of fees.
Assuming perfect consistency. The calculator assumes the same contribution every month for the whole period. Real life rarely works that way. A 6 month gap in year 5 of a 20 year plan costs more than the $4,200 in missed contributions, because that money would have kept compounding for the remaining 15 years too. The real cost is closer to $13,800. A 3 to 6 month emergency fund means a rough patch in your income doesn't automatically become a gap in your investing.
Why contribution consistency beats almost everything else
Most people focus on finding a better investment or chasing a higher return. The numbers suggest that's the wrong priority. At $700 a month for 20 years, an 8% return gets you to roughly $412,000, while a 10% return gets you to roughly $532,000, a $120,000 gain. Meaningful, but look what happens if you increase the contribution instead: $700 a month at 8% for 20 years gets you $412,000, while $900 a month at 8% gets you roughly $530,000. Adding $200 a month, about $46 a week, gets you almost the same result as finding a 2% better return, and you have far more control over your contribution than you ever will over the market.
The reason consistency matters so much is that most people don't actually invest consistently. They invest when they remember, when there's extra cash lying around, when the market feels good. That's not a plan, it's a habit that breaks the moment life gets busy. The fix is automation: set up a direct debit into your brokerage the day after your pay lands, so the decision is already made before you get a chance to spend it. If you haven't nailed down what you're actually saving towards yet, our guide on setting financial goals you'll actually achieve is a good place to start before you run the numbers here.
Using this calculator for specific Australian goals
A house deposit. Australia's national median house price sits around $780,000, so a 20% deposit is about $156,000. This is a short-to-medium-term goal, so lean on a high-interest savings account return of 4.5 to 5% rather than share market assumptions. At $700 a month and 5%, that's roughly 13 years. At $1,500 a month, roughly 7 years. If your deposit is under 5 years away, keep the money out of the share market entirely.
A FIRE portfolio. The 25x annual expenses rule means a $60,000-a-year lifestyle needs a $1,500,000 portfolio. Plug that in as your target, and use a real (after-inflation) return like 7%, which is what the Australian FIRE community commonly uses for conservative long-term planning. At $700 a month and 7% real, that's roughly 35 years from $0. At $1,500 a month, closer to 23 years. Worth noting: this calculator only models money outside super, and your employer super contributions are quietly building a second pot in parallel. If FIRE is the goal, our guide to what FIRE actually means and how it plays out in Australia covers the different flavours and the bits this calculator can't see.
Your first $100k. At $700 a month and 8%, you'll have personally contributed about $71,000 of the $100,000 by the 8.4 year mark, with returns making up the rest. After that, your portfolio starts generating $7,000 to $8,000 a year on its own at 8%, which is over $600 a month in growth without you lifting a finger. Use the calculator to find the monthly contribution that gets you there in your target timeframe, then automate it.
FAQ
How long does it take to save $1 million in Australia?
It comes down almost entirely to your monthly contribution and your assumed return. At $700 a month and an 8% annual return starting from $0, you're looking at roughly 29.5 years. Bump that to $1,500 a month at 10% and it drops to around 19 years. Most working Australians who talk about hitting $1 million treat it as a 15 to 25 year plan, depending on income and how much they can save. There's no shortcut, just consistent contributions and a return assumption you can actually defend.
How long does it take to reach $100,000 investing?
At $700 a month and 8%, starting from $0, about 8.4 years. At $1,000 a month and 10%, under 7 years. The first $100k is the slowest stretch of the whole journey because your own contributions are doing almost all the work while the balance is still small. After that, returns start pulling more weight and things pick up.
What annual return should I use in the calculator for Australian shares?
For a diversified mix of Australian and global ETFs (think VAS, VGS, DHHF), 7 to 9% per year after fees is a realistic long-term assumption. The ASX 200 has returned around 9 to 10% including dividends over the long run, but that's before fees and tax eat into it. Use 6% if you'd rather be conservative. Steer clear of anything north of 12% for a diversified portfolio, no index fund has sustained that over decades.
Does the calculator account for inflation?
No, it works in nominal dollars. If you'd rather think in today's purchasing power, subtract your expected inflation rate from the return you enter. The RBA targets 2 to 3% inflation a year, so an 8% nominal return becomes roughly 5.5 to 6% in real terms. This matters most for long goals: $1 million in 30 years buys a lot less than $1 million today.
How much do I need to invest each month to reach $1 million?
Working backwards from an 8% return, around $700 a month gets you there in about 29.5 years from $0. Want it in 20 years instead? You'd need roughly $1,700 a month. In 15 years, closer to $2,900 a month. The shorter your timeline, the bigger the contribution needs to be, since compounding has less time to carry the load for you.
What is the Rule of 72 and how does it apply here?
It's a quick mental shortcut: divide 72 by your annual return to estimate how many years it takes a lump sum to double. At 6%, that's about 12 years. At 8%, about 9 years. At 10%, about 7.2 years. It only works for an existing lump sum sitting there growing, not for an ongoing contribution stream, so use this calculator for the full picture and the Rule of 72 as a quick sanity check on a balance you already have.
Is 5 years long enough to invest in shares?
Five years is generally treated as the minimum for share market investing, and even then it's not risk-free. Markets can fall 20 to 40% in a downturn and take a few years to recover, so a bad stretch right at the end of a 5 year plan could leave you short. If you need the money within 5 years, a high-interest savings account is the safer home for it. For goals 7 years or further out, a diversified ETF portfolio is generally appropriate.
How long does it take to save a house deposit in Australia?
A 20% deposit on the national median house price of around $780,000 works out to about $156,000. Saved in a high-interest savings account earning around 5%, that's roughly 13 years at $700 a month, or about 7 years at $1,500 a month. A house deposit is a short-to-medium-term goal, so it shouldn't be sitting in the share market where a downturn could hit right when you need the cash.
What happens if I miss contributions for a few months?
More than most people expect. Missing $700 a month for 6 months is $4,200 in skipped contributions, but if that money would otherwise have kept compounding at 8% for another 15 years, the real cost is closer to $13,800. The earlier the gap happens, the more it costs you down the track, which is exactly why an emergency fund matters. It stops a rough patch in your income from turning into a permanent dent in your plan.
Should I use this calculator for my superannuation goal?
You can use it as a rough guide, but treat the result with a grain of salt. Super has its own contribution rules, tax treatment and access restrictions that this calculator doesn't model, including employer contributions and the concessional contribution cap. For a proper super projection, use your fund's own retirement calculator or ASIC's MoneySmart tool. This calculator is really built for the investing you do outside super.
How accurate is this calculator?
The maths is accurate for whatever you enter, using the standard compound growth formula with monthly compounding. What it can't do is predict the future: real returns aren't smooth year to year, and it doesn't account for tax, inflation or fees unless you've already baked those into your return assumption. Treat the output as a planning estimate you can compare scenarios against, not a guaranteed date circled on a calendar.
What's the difference between this calculator and a compound interest calculator?
A compound interest calculator answers 'given a starting amount and a rate, how much will I have after X years?' This one flips the question around: 'given my starting amount, contributions and rate, how long until I hit my target?' Same formula underneath, just solving for a different variable. If you know your timeline and want the end balance, use a compound interest calculator. If you know your target and want the timeline, use this one.
Related reading
How to Set Financial Goals You'll Actually Achieve
Why most financial goals don't survive the year (real ASIC data), the SMART framework's origin, and how to turn any goal into a monthly number.

What Is FIRE? Financial Independence, Retire Early Explained
What FIRE (Financial Independence, Retire Early) actually means, the different flavours, the 4% rule, and how it plays out in Australia.
What Is Compound Interest? (And Why It's the Whole Point of Investing Early)
A plain-English explanation of compound interest, why starting early matters more than the amount, and how the same effect works against you on debt.
Where these numbers come from
Every rate and threshold in this calculator was read off the official page, not copied from another calculator. Check them yourself, they change.
📚 Recommended reading
The Simple Path to Wealth
JL Collins
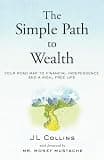
The Simple Path to Wealth
The friendliest on-ramp to index investing there is, born from letters a dad wrote his daughter. It makes 'buy the whole market and chill' feel obvious, just map his US fund picks onto Aussie equivalents and super.
The Little Book of Common Sense Investing
John C. Bogle
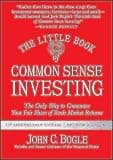
The Little Book of Common Sense Investing
From the man who invented the index fund, this is the short, sharp case for low-cost investing that has aged like fine wine. The maths on fees is universal, just think ETFs and super instead of his US funds.
Some links above are affiliate links. If you buy through them, Snowball Invest may earn a small commission at no extra cost to you. We only recommend books we'd suggest anyway.
SnowLetter
Australia's money news and our best reads, once a week.
Disclaimer
The results provided by this calculator are estimates only, based on the assumptions you enter, and are not a prediction or financial advice. Actual timelines will vary. Consider speaking with a licensed financial adviser before making any financial decision.